Suppose that the demand and price for strawberries is related by a linear demand function of the form
p= D(x)
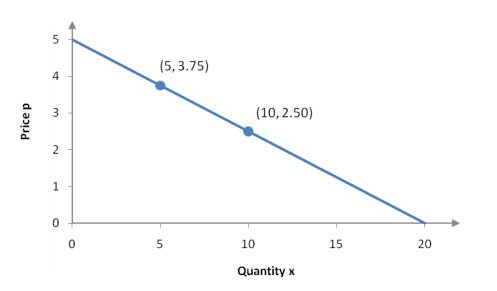
where p is the price (in dollars) and x is the demand in hundreds of quarts. We know that if the demand is 1000 quarts, the price is $2.50. Furthermore, if the demand is 500 quarts, the price is $3.75. Use this information to find the revenue function R(x).
To solve this problem, we first need to create the demand function p = D(x) and then use it to find the revenue function R(x). Note that in some economics application the quantity will be referenced with the variable q instead of x.
Since the demand function is linear, we know that it can be written in slope-intercept form as
p= mx + b
We need to find the m and b from the information regarding price and quantity. Notice that we can write this data as two ordered pairs (5, 3.75) and (10, 2.50). These ordered pairs have the form (x, p) where we need to take care and write x in hundreds of quarts.

To find the slope m, we need to calculate

With the slope, we can now write our demand function as
p= −0.25x + b
To solve for b, substitute one of the ordered pairs into the equation:

The demand function is p = −0.25x + 5.
Find the Revenue Function
The revenue function is found by observing that
revenue = price × quantity
Since we are looking for revenue as a function of the quantity x, we’ll rewrite this as
R(x) = px
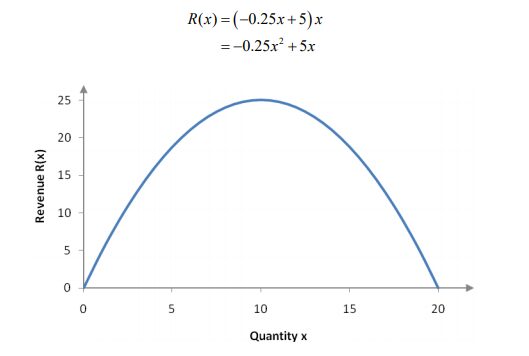
where the price p is given by the demand equation above. Substituting this into our revenue function yields

This graph starts at the origin (selling no products makes no revenue) and increases until x = 10. At this point the demand has lowered to a level that cuts into revenue causing it to begin to decrease.


