In economics, the term marginal is used to indicate the change in some benefit or cost when an additional unit is produced. For instance, the marginal revenue is the change in total revenue when an additional unit is produced. If we let the total revenue function be represented by TR (Q) , where Q is the number of units produced and sold, then the marginal revenue is calculated with the difference
Marginal Revenue = TR(Q +1) −TR(Q)
Since this is a difference, it corresponds to a change in revenue. The production levels
Qand Q +1 differ by one units, so TR(Q +1) − TR(Q) describes the change in total revenue when production is changed by one unit.
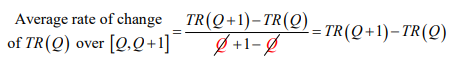
The marginal revenue can also be interpreted as an average rate of change. Using the definition of average rate of change, the average rate of change of R (Q) over [Q,Q +1] is
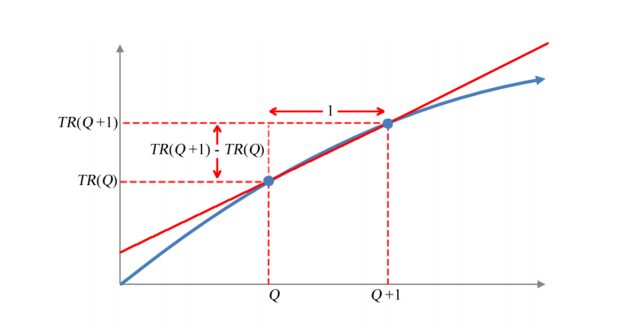
Let’s label these quantities on a graph of a revenue function TR(Q).
Figure 1 – A revenue function TR(Q) (blue) with a secant line (red) passing through two points (Q, TR(Q)) and (Q+1, TR(Q+1)).
In addition to being equal to the average rate of change of TR(Q) over [Q,Q +1], we can view the marginal revenue as a slope. If we calculate the slope of the secant line between the points (Q,TR(Q)) and (Q +1,TR (Q +1)) , we get a numerator equal to
TR (Q +1) − TR (Q) and denominator equal to 1. This yields the same expression, TR (Q +1) − TR (Q) , as the marginal revenue.
Now let’s compare this slope to the slope of a tangent line to the revenue function TR(Q).
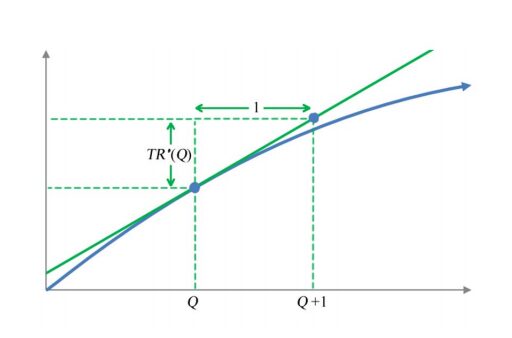
Figure 2 – A revenue function R(Q) (blue) with a tangent line (green) at (Q,R(Q)).
In Figure 2, we have placed the point of tangency on the graph at (Q,TR (Q)) . Another point is placed on the tangent line at Q +1 . Since these points are separated by 1 unit and the slope of the tangent line is TR′(Q) , the points must be separated vertically by
TR′(Q) . This insures that the slope of the tangent line between these points is TR′(Q) 1 or TR′(Q) .
These graphs may appear almost identical, so let’s compare them side by side.
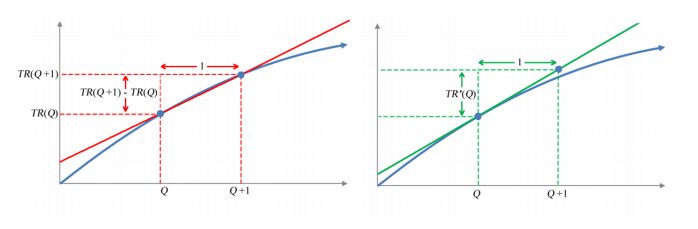
Figure 3 – A revenue function R(Q) with a secant line (red) and a tangent line (green).
The secant line (red) and the tangent line (green) both pass through (Q,TR (Q)) .
However, the tangent line is slightly steeper and passes through a slightly higher point than the secant line. This means the slope of the tangent line is approximately the same as the slope of the secant line. In terms of the revenue,
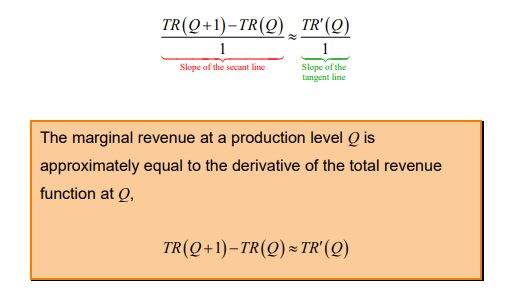
We can evaluate the derivative of the revenue function to estimate the marginal revenue at any production level.
Example 1. Find and Interpret the Marginal Revenue
Based on sales data from 2000 to 2009, the relationship between the price per barrel of beer P at the Boston Beer Company and the number of barrels sold annually, Q, can be modeled by the power function
P= 209.7204Q−0.0209
where Q is in thousands of barrels.
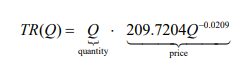
a. Find the revenue function TR(Q) .
Solution. To find the revenue, we must multiply the quantity times the price. In this example, the quantity of beer is represented by Q in thousands of barrels and the price per barrel is reprensented by in dollars per barrel. The revenue function is
Simplifying the function by combining the factors,
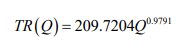
where the exponents have been added on the Q factors.
The units of the revenue function are very important. By multiplying the units on the price and the quantity, we can determine the units on the revenue function:
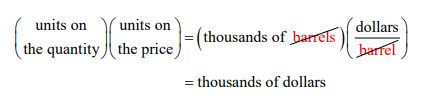
We complete the total revenue function by labeling the units on the function and write
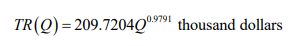
b. Find the annual revenue when 1,500,000 barrels of beer are sold.
Solution The annual revenue from 1,500,000 barrels of beer is found by substituting this production level into R(Q) . Since Q is in thousands of barrels, we need to divide the production level by 1000 to scale it properly,
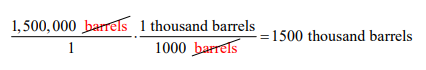
The conversion factor, 1 thousand barrels , is equal to 1 and converts 1000 barrels 1,500,000 barrels to 1500 thousand barrels. The revenue at this product
level is
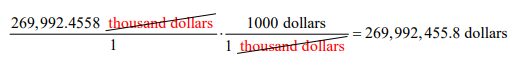
TR(1500) = 209.7204(1500)0.9791 ≈ 269,992.4558 thousand dollars
We can convert this amount to dollars by multiplying by 1000,
c. Approximate the marginal revenue when 1,500,000 barrels of beer are sold.
Solution. The marginal revenue at 1,500,000 barrels of beer is approximated by TR′(1500) . We can find the derivative using the power rule for derivatives,
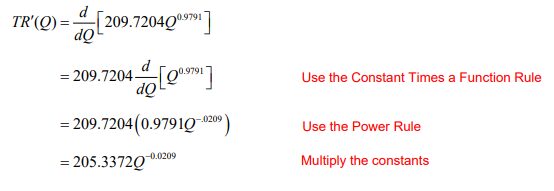
The marginal revenue is approximately
TR′(1500) = 205.3372(1500)−0.0209 ≈ 176.2330
d. How will revenue change if production is increased from 1,500,000 barrels?
Solution The marginal revenue is the same as the instantaneous rate of change and has the same units. These units are found by dividing the units on the dependent variable by the units on the independent variable,
The marginal revenue is about 176.2330 dollars per barrel meaning that an increase in production of one barrel will result in an increase in revenue of approximately 176.23 dollars.
The actual increase is found by subtract the revenue at each level,
TR(1500.001) − TR(1500) = 209.7204(1500.001)0.9791 − 209.7204(1500)0.9791 ≈ 0.17623309 thousand dollars or 176.23309 dollars.
The marginal cost is the change in cost when an additional unit is produced. If Q units are produced at a total cost TC(Q) , the marginal cost is defined as
Marginal Cost = TC (Q +1) −TC (Q)
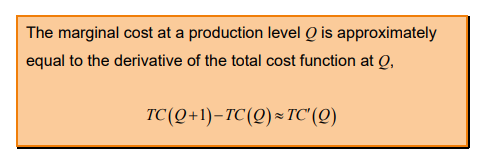
This definition is identical to the definition of marginal revenue except that the total cost function is used instead of the total revenue function. Like the marginal revenue, the marginal cost at a production level Q is approximately the same as the derivative of the total cost function.
Example 2. Find and Interpret the Marginal Cost
The total cost TC (Q) to produce Q thousand barrels of beer at the Craft Brewers Alliance from 2000 to 2009 is given by the function
TC(Q) = −0.0024Q3 + 2.9978Q2 − 961.4000Q +119249.2929
where the cost is in thousands of dollars.
a. Approximate the marginal cost for a production level of 300,000 barrels of beer.
Solution The marginal cost at a production level of 300,000 barrels of beer is approximated by TC′(Q) at that production level. The derivative of the cost function is
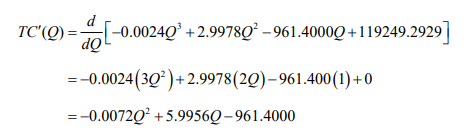
Since the quantity Q is in thousands of barrels, we must substitute 300 thousand into TC′(Q) to estimate the marginal revenue at 300,000 barrels. When we do this, we get
TC′(300) = −0.0072(300)2 + 5.9956(300) − 961.4000 = 189.28
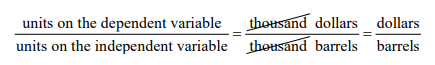
Since this number is a rate, the units on this value is
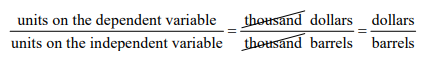
a. What does the marginal cost at this production level tell you about beer production at the Craft Brewers Alliance?
Solution Since costs are increasing at 189.28 dollars per barrel, an increase in production of 1 barrel (from 300,000 to 300,001 barrels) will result in an increase in cost of 189.28 dollars.


